Downloading, Replacing, Appending Data
Downloading
If you have the permissions to do that, from the dataset detail page it will be possible to download it in several output format. The conversion will be performed automatically by GeoNode through the OGC Protocols.
-
Move to the
Mainrdlayerhttp://localhost/layers/geonode_data:geonode:Mainrd -
Click on the
Download Layerbutton; it will show up a small window with several options and choices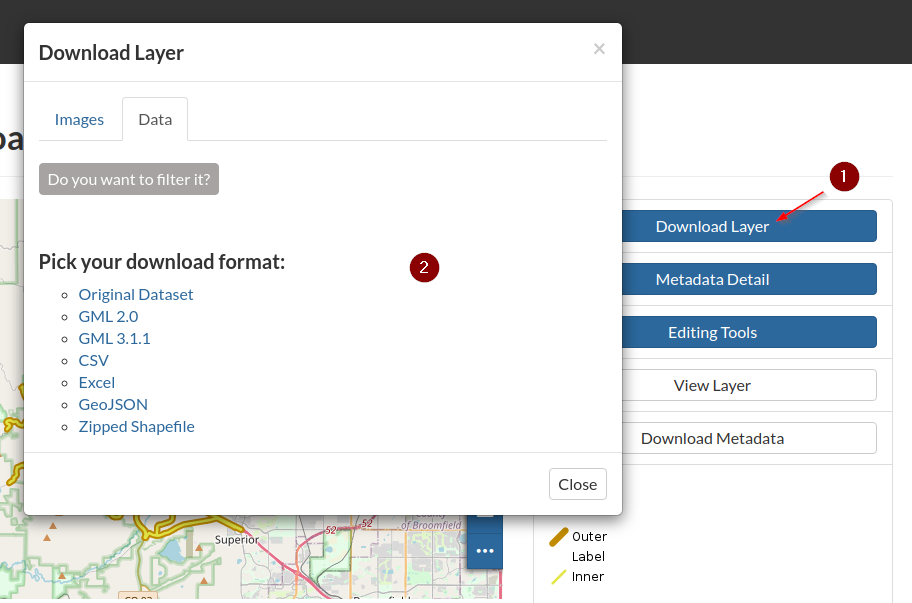
-
The first tab,
Images, is not tipically much useful. It does not allow you to download any kind of raw data, but just some portryals in several image format, which could be used eventually as thumbnails if needed. You can try out by clicking on some of the available image formats. -
The second tab,
Data, allow you to download the whole dataset or a subset of it in some different download format.
Downloading the whole dataset
From the Data section it is possible to download the raw data into several output formats.
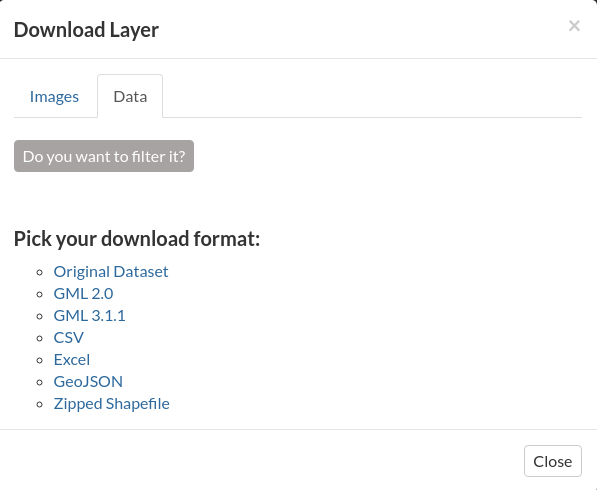
- The
Original Datasetlink, will allow you to retrieve the original files used to create the dataset the first time. This link might be unavailable in some cases:- The dataset has been created from the backend, i.e. it has not been uploaded from the
Upload Panel - The original files are not available anymore on the file system
- The administrator removed the link
- The dataset has been created from the backend, i.e. it has not been uploaded from the
- Moreover the
Original Datasetlink differs from the others for two main things:- It will always ignore any kind of filter appliead to the
Download Formand it will provide the whole files. - It may refer to some external repository in the case the administrator has changed it. In that case it will redirect the download of the files to some external storagre.
- It will always ignore any kind of filter appliead to the
- Other
download formats; those ones are available accordingly to:- The type of dataset; it is possible that some datasets could not be converted on some specific dataset (e.g. vectorial and rasters)
- Plugins availablity on
GeoServer; the conversion in this case will be done by the backend on-the-fly. The available outputs, therefore, depend on their availability on the geospatial service.
Obtaining a filtered subset
This option is valid only for VECTORIAL datasets.
- From the
Datasection it is possible to create and apply some filtering in order to get only a subset of the whole dataset. -
Click and enable the
Do you want to filter it?button from theDownloadtab. It will take some time to parse the values from the backend.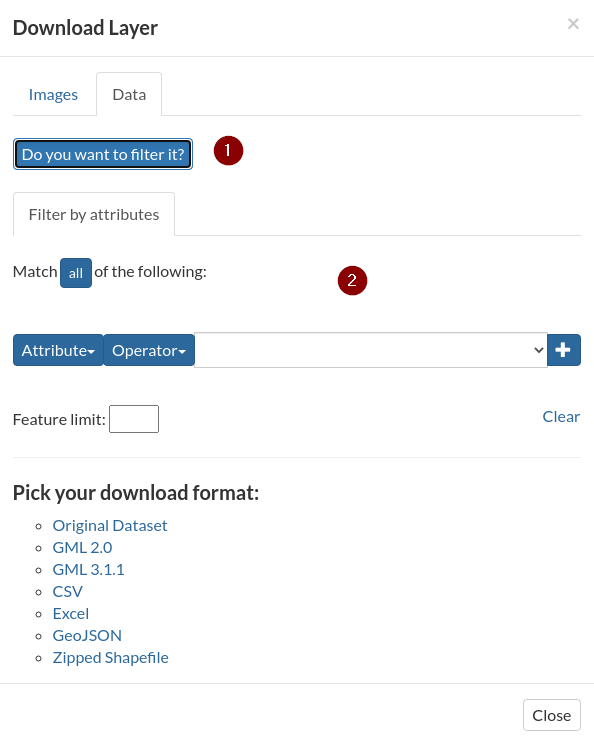
-
First of all select the type of logic operator,
All == AND,Any == OR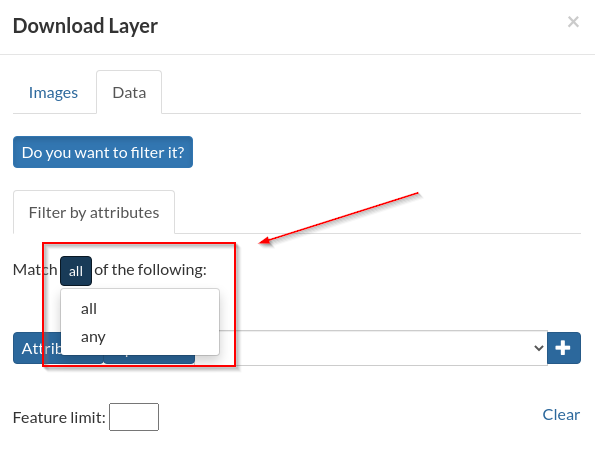
-
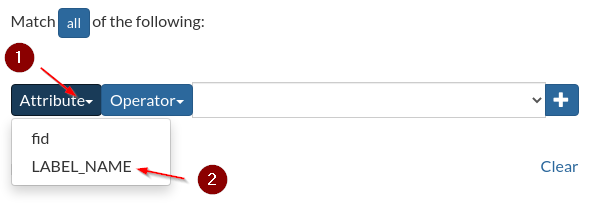
Next, select the attribute you want to use to filter the subset
-
Select the logic operator to match the value, e.g.
LIKEmeanscontains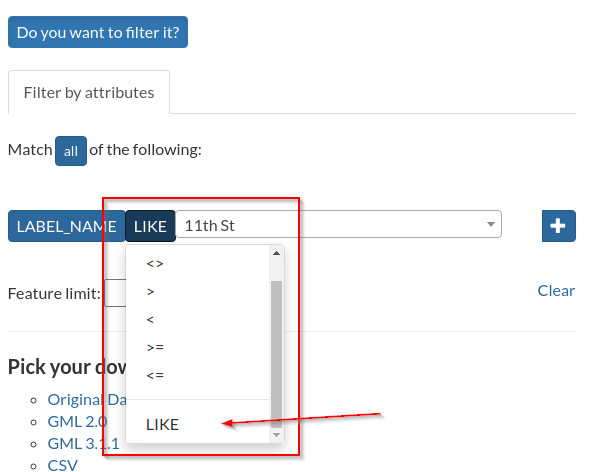
-
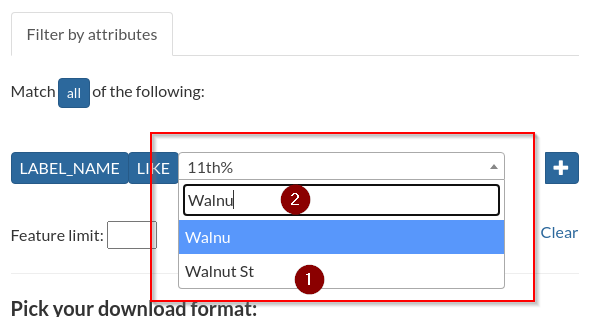
Select from the values list or enter a custom one
-
Click on the
+button in order to add the condition to the filter; notice how the selected condition will be listed below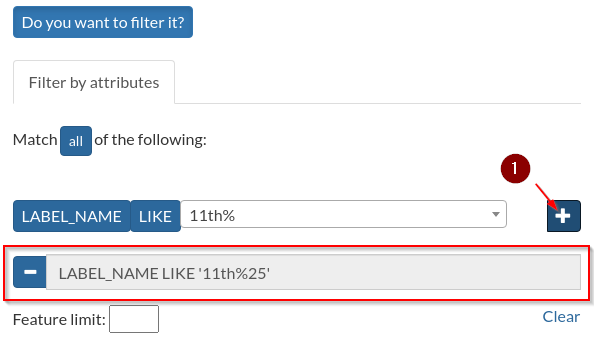
-
Through the
Feature Limitit is possible to further limit the number of the records returned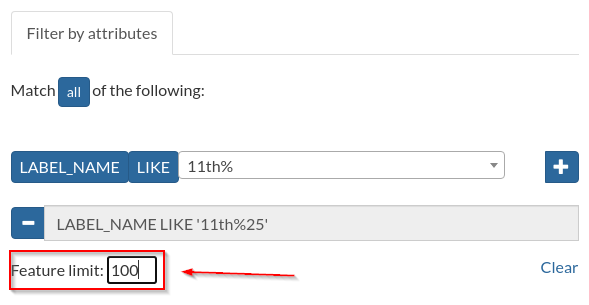
-
The following one is an example of
ORfilter on theLABEL_NAMEattribute using aLIKEoperator in order to match more results; the outcome is then limited to the first100records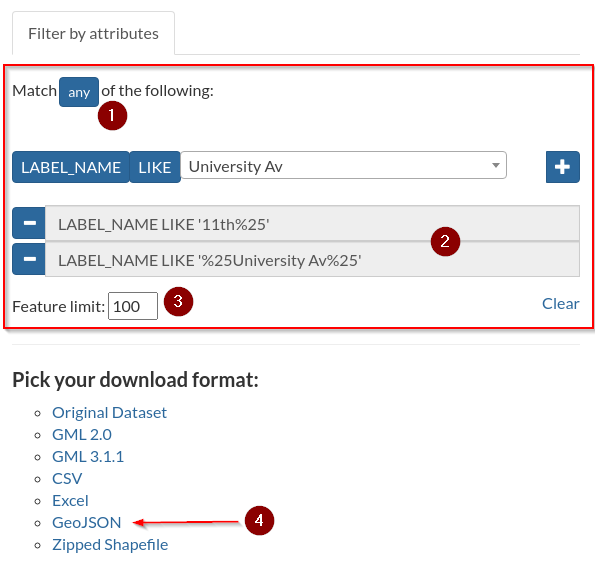
-
Finally select the
Output Formatyou want the results to; e.g. by selectingGeoJSONyou will get the following results form the above example{ "type": "FeatureCollection", "features": [ { "type": "Feature", "id": "Mainrd.59", "geometry": { "type": "MultiLineString", "coordinates": [ [ [ 3062088.181, 1249165.789 ], [ 3062451.08, 1249272.489 ] ] ] }, "geometry_name": "the_geom", "properties": { "fid": 59, "LABEL_NAME": "Walnut St" } }, { "type": "Feature", "id": "Mainrd.61", "geometry": { "type": "MultiLineString", "coordinates": [ [ [ 3061723.714, 1249069.253 ], [ 3062088.181, 1249165.789 ] ] ] }, "geometry_name": "the_geom", "properties": { "fid": 61, "LABEL_NAME": "Walnut St" } }, { "type": "Feature", "id": "Mainrd.86", "geometry": { "type": "MultiLineString", "coordinates": [ [ [ 3061355.12, 1248969.761 ], [ 3061723.714, 1249069.253 ] ] ] }, "geometry_name": "the_geom", "properties": { "fid": 86, "LABEL_NAME": "Walnut St" } }, { "type": "Feature", "id": "Mainrd.88", "geometry": { "type": "MultiLineString", "coordinates": [ [ [ 3062451.08, 1249272.489 ], [ 3062824.349, 1249369.35 ] ] ] }, "geometry_name": "the_geom", "properties": { "fid": 88, "LABEL_NAME": "Walnut St" } }, { "type": "Feature", "id": "Mainrd.140", "geometry": { "type": "MultiLineString", "coordinates": [ [ [ 3059898.114, 1248600.093 ], [ 3059912.48, 1248594.44 ], [ 3059941.91, 1248593.56 ], [ 3060145.13, 1248645.4 ], [ 3060250.16, 1248676.419 ] ] ] }, "geometry_name": "the_geom", "properties": { "fid": 140, "LABEL_NAME": "Walnut St" } }, { "type": "Feature", "id": "Mainrd.229", "geometry": { "type": "MultiLineString", "coordinates": [ [ [ 3060987.191, 1248873.845 ], [ 3061355.12, 1248969.761 ] ] ] }, "geometry_name": "the_geom", "properties": { "fid": 229, "LABEL_NAME": "Walnut St" } }, { "type": "Feature", "id": "Mainrd.255", "geometry": { "type": "MultiLineString", "coordinates": [ [ [ 3060619.651, 1248775.923 ], [ 3060987.191, 1248873.845 ] ] ] }, "geometry_name": "the_geom", "properties": { "fid": 255, "LABEL_NAME": "Walnut St" } }, { "type": "Feature", "id": "Mainrd.321", "geometry": { "type": "MultiLineString", "coordinates": [ [ [ 3060250.16, 1248676.419 ], [ 3060619.651, 1248775.923 ] ] ] }, "geometry_name": "the_geom", "properties": { "fid": 321, "LABEL_NAME": "Walnut St" } }, { "type": "Feature", "id": "Mainrd.527", "geometry": { "type": "MultiLineString", "coordinates": [ [ [ 3063555.141, 1249566.88 ], [ 3063930.22, 1249668.529 ] ] ] }, "geometry_name": "the_geom", "properties": { "fid": 527, "LABEL_NAME": "Walnut St" } }, { "type": "Feature", "id": "Mainrd.579", "geometry": { "type": "MultiLineString", "coordinates": [ [ [ 3064612.55, 1249853.859 ], [ 3064809.989, 1249906.62 ] ] ] }, "geometry_name": "the_geom", "properties": { "fid": 579, "LABEL_NAME": "Walnut St" } }, { "type": "Feature", "id": "Mainrd.632", "geometry": { "type": "MultiLineString", "coordinates": [ [ [ 3061252.3, 1249341.19 ], [ 3061201.959, 1249524.828 ] ] ] }, "geometry_name": "the_geom", "properties": { "fid": 632, "LABEL_NAME": "11th St" } }, { "type": "Feature", "id": "Mainrd.633", "geometry": { "type": "MultiLineString", "coordinates": [ [ [ 3065453.729, 1250103.404 ], [ 3065760.373, 1250187.36 ] ] ] }, "geometry_name": "the_geom", "properties": { "fid": 633, "LABEL_NAME": "Walnut St" } }, { "type": "Feature", "id": "Mainrd.704", "geometry": { "type": "MultiLineString", "coordinates": [ [ [ 3064294.881, 1249767.116 ], [ 3064317.058, 1249773.172 ], [ 3064612.55, 1249853.859 ] ] ] }, "geometry_name": "the_geom", "properties": { "fid": 704, "LABEL_NAME": "Walnut St" } }, { "type": "Feature", "id": "Mainrd.720", "geometry": { "type": "MultiLineString", "coordinates": [ [ [ 3063192.21, 1249469.411 ], [ 3063555.141, 1249566.88 ] ] ] }, "geometry_name": "the_geom", "properties": { "fid": 720, "LABEL_NAME": "Walnut St" } }, { "type": "Feature", "id": "Mainrd.779", "geometry": { "type": "MultiLineString", "coordinates": [ [ [ 3066127.684, 1250290.216 ], [ 3066254.58, 1250325.75 ], [ 3066333.921, 1250344.23 ] ] ] }, "geometry_name": "the_geom", "properties": { "fid": 779, "LABEL_NAME": "Walnut St" } }, { "type": "Feature", "id": "Mainrd.811", "geometry": { "type": "MultiLineString", "coordinates": [ [ [ 3061355.12, 1248969.761 ], [ 3061303.024, 1249159.043 ] ] ] }, "geometry_name": "the_geom", "properties": { "fid": 811, "LABEL_NAME": "11th St" } }, { "type": "Feature", "id": "Mainrd.841", "geometry": { "type": "MultiLineString", "coordinates": [ [ [ 3065397.156, 1250087.79 ], [ 3065453.729, 1250103.404 ] ] ] }, "geometry_name": "the_geom", "properties": { "fid": 841, "LABEL_NAME": "Walnut St" } }, { "type": "Feature", "id": "Mainrd.879", "geometry": { "type": "MultiLineString", "coordinates": [ [ [ 3063930.22, 1249668.529 ], [ 3064294.881, 1249767.116 ] ] ] }, "geometry_name": "the_geom", "properties": { "fid": 879, "LABEL_NAME": "Walnut St" } }, { "type": "Feature", "id": "Mainrd.988", "geometry": { "type": "MultiLineString", "coordinates": [ [ [ 3064809.989, 1249906.62 ], [ 3064945.19, 1249942.75 ], [ 3065017.521, 1249974.065 ] ] ] }, "geometry_name": "the_geom", "properties": { "fid": 988, "LABEL_NAME": "Walnut St" } }, { "type": "Feature", "id": "Mainrd.1223", "geometry": { "type": "MultiLineString", "coordinates": [ [ [ 3062824.349, 1249369.35 ], [ 3063192.21, 1249469.411 ] ] ] }, "geometry_name": "the_geom", "properties": { "fid": 1223, "LABEL_NAME": "Walnut St" } }, { "type": "Feature", "id": "Mainrd.1237", "geometry": { "type": "MultiLineString", "coordinates": [ [ [ 3061303.024, 1249159.043 ], [ 3061252.3, 1249341.19 ] ] ] }, "geometry_name": "the_geom", "properties": { "fid": 1237, "LABEL_NAME": "11th St" } }, { "type": "Feature", "id": "Mainrd.1368", "geometry": { "type": "MultiLineString", "coordinates": [ [ [ 3065017.521, 1249974.065 ], [ 3065032.087, 1249979.471 ], [ 3065111.59, 1250008.98 ], [ 3065397.156, 1250087.79 ] ] ] }, "geometry_name": "the_geom", "properties": { "fid": 1368, "LABEL_NAME": "Walnut St" } }, { "type": "Feature", "id": "Mainrd.1383", "geometry": { "type": "MultiLineString", "coordinates": [ [ [ 3065760.373, 1250187.36 ], [ 3066127.684, 1250290.216 ] ] ] }, "geometry_name": "the_geom", "properties": { "fid": 1383, "LABEL_NAME": "Walnut St" } }, { "type": "Feature", "id": "Mainrd.1461", "geometry": { "type": "MultiLineString", "coordinates": [ [ [ 3061201.959, 1249524.828 ], [ 3061156.17, 1249707.58 ] ] ] }, "geometry_name": "the_geom", "properties": { "fid": 1461, "LABEL_NAME": "11th St" } } ], "totalFeatures": 24, "numberMatched": 24, "numberReturned": 24, "timeStamp": "2021-10-11T09:07:21.487Z", "crs": { "type": "name", "properties": { "name": "urn:ogc:def:crs:EPSG::2876" } } }
Replace and Append Data
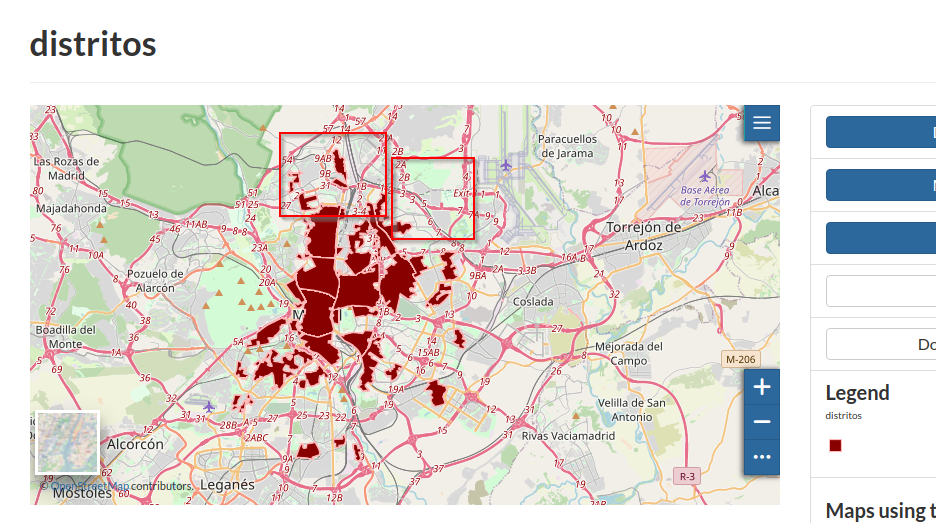
In order to execute this exercise let’s use some specifi sample dataset that will allow us to better visualize the outputs.
-
From
/opt/data/sample_data/append_data_samples/distritosupload thedistritos.shpShapefile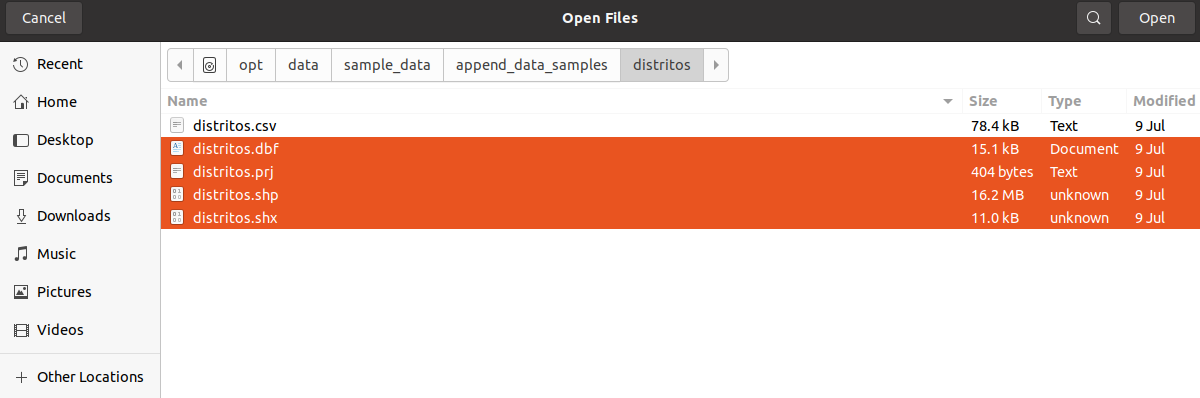
-
Go to the
distritoslayer detail page and click onEditing Tools > Layer > Edit Data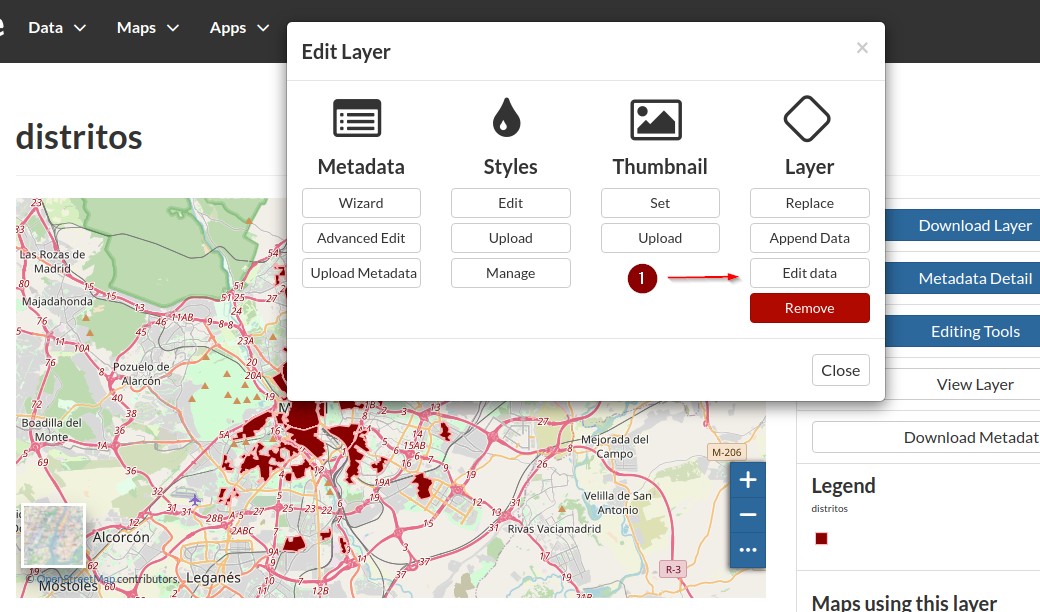
-
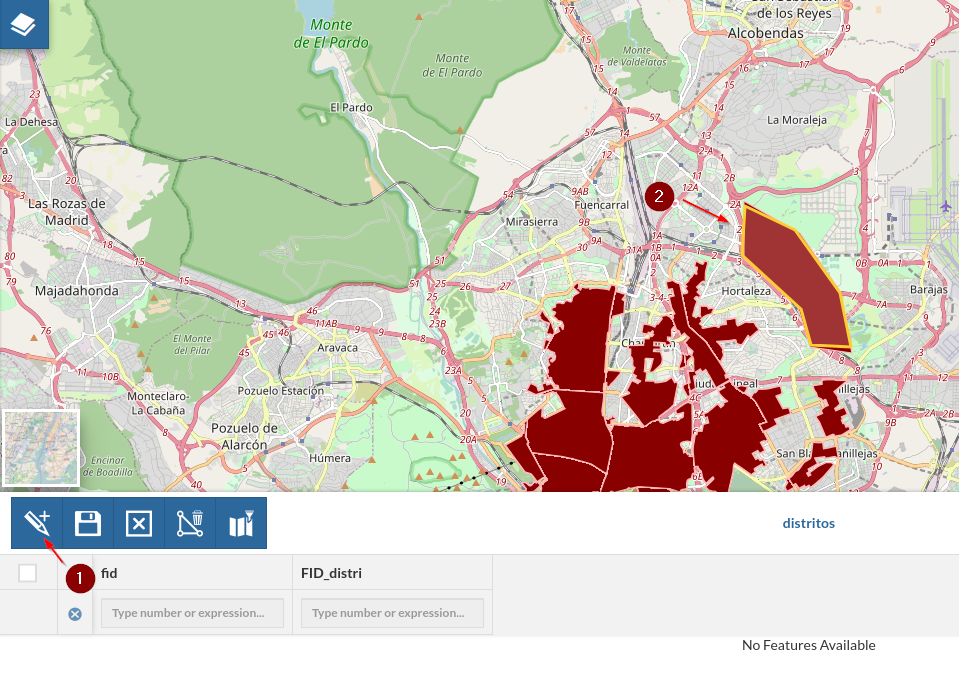
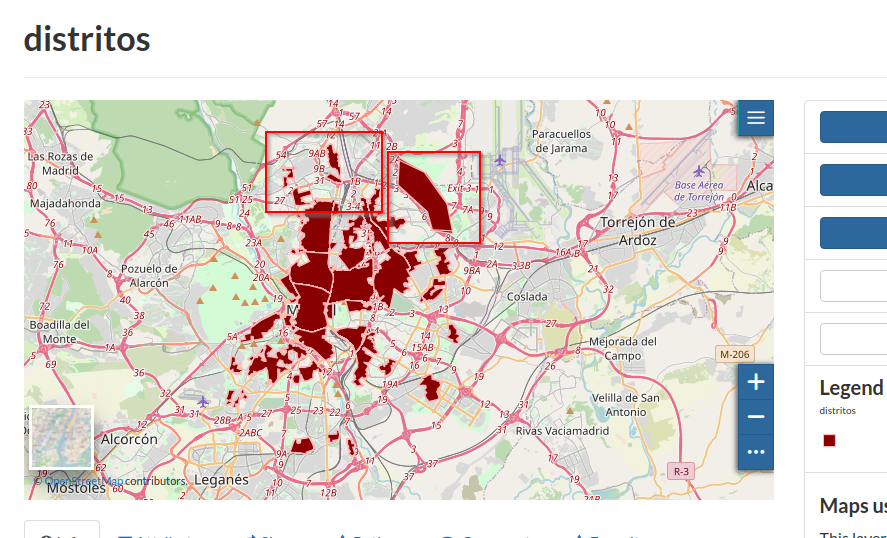
Add a new polygon as shown in the figure below
-
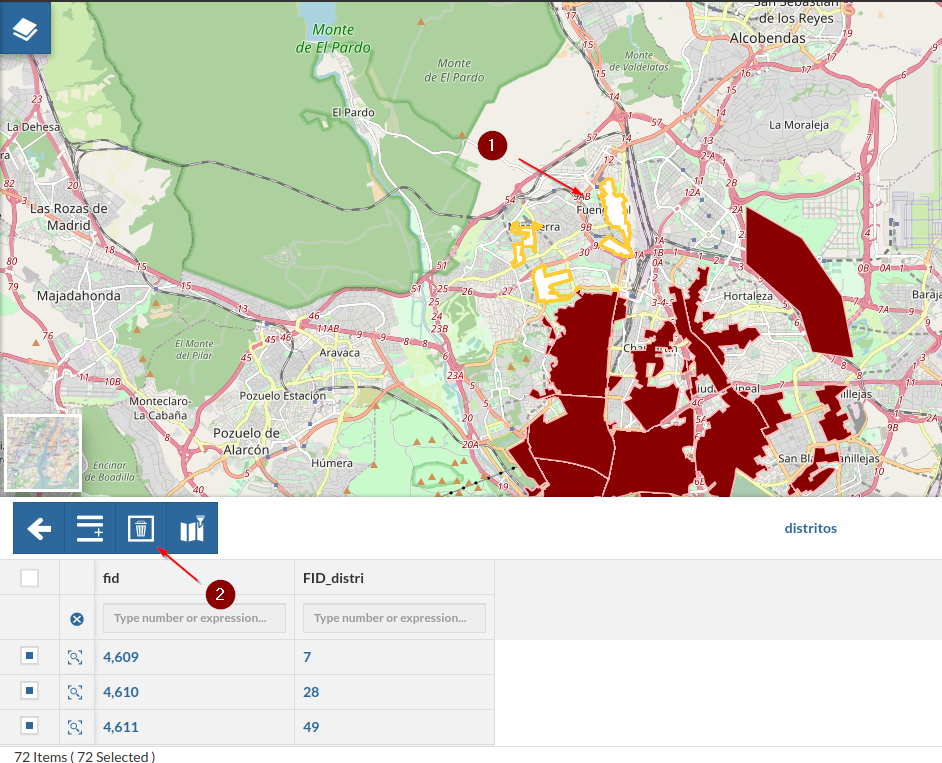
Delete some features as shown in the figure below
-
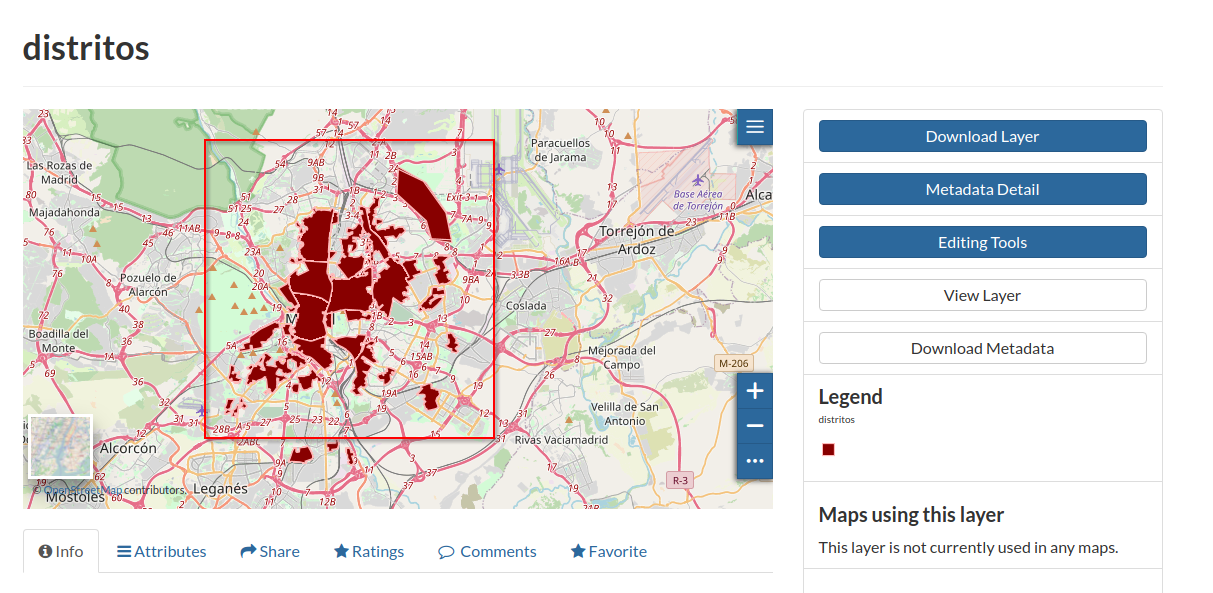
Go back to the layer details page; remeber to clear the image cache of the browser everytime you perform an edit operation
-
Go to the
Editing Tools > Layer > Append Data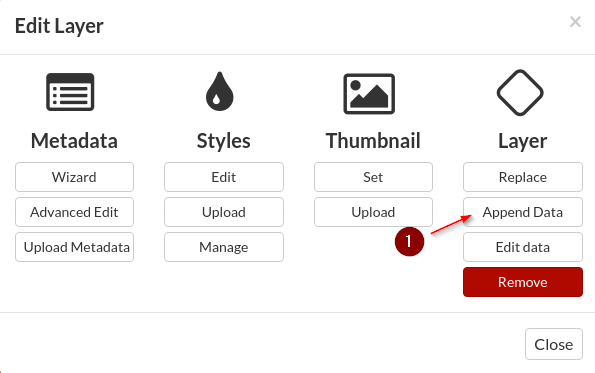
-
Select the
distritosshapefiles again and append them to the layer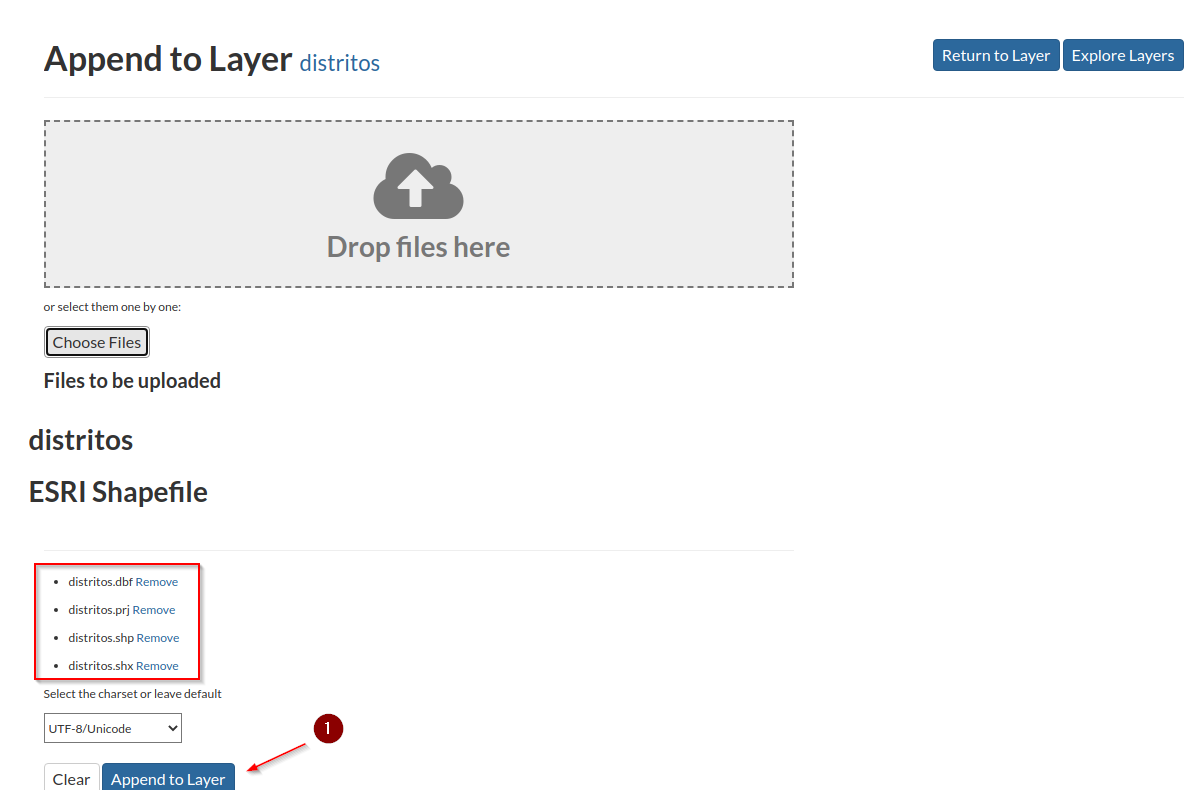
-
Go back to the layer details page, clear the image cache of the browser and refresh the page; notice that the operation restored the old deleted features by preserving the new ones
-
Repeat the same this time by using the
Replace Layeroperation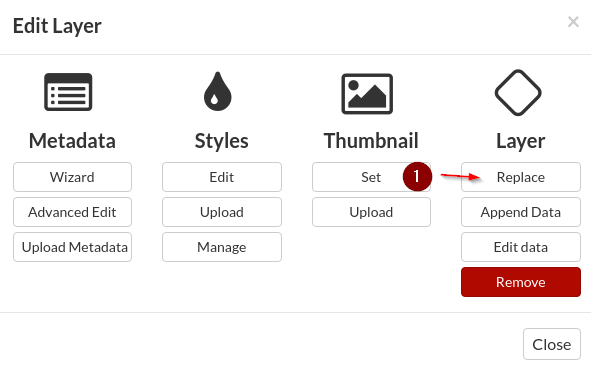
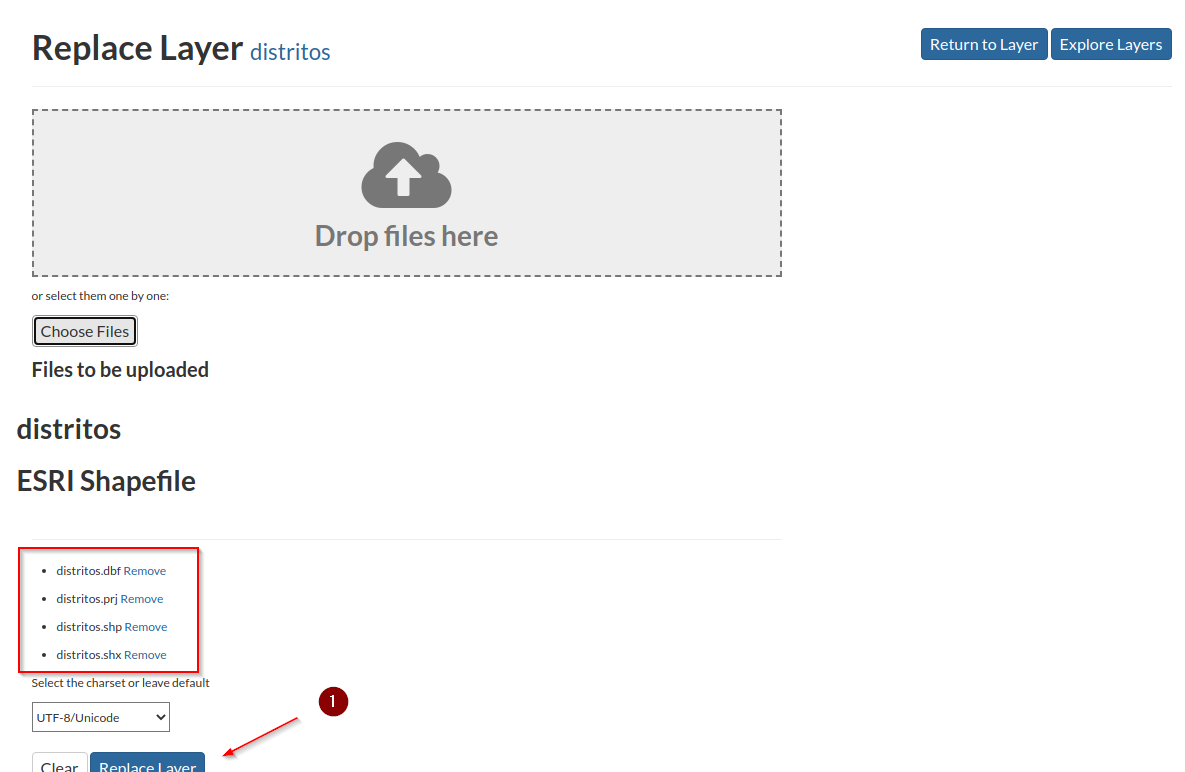
-
Go back to the layer details page, clear the image cache of the browser and refresh the page; notice now that the layer features have been restored to the original ones